 StatusTrail
Getting started
1. Install
- Click
 , choose the account to install it on, and authorize. StatusTrail requests a single permission: read your boards' data. It never changes anything on your boards.
2. Add the view to a board
- Open any board with a Status column.
- Next to the board's view tabs, click + Add view.
- Choose StatusTrail.
3. First run
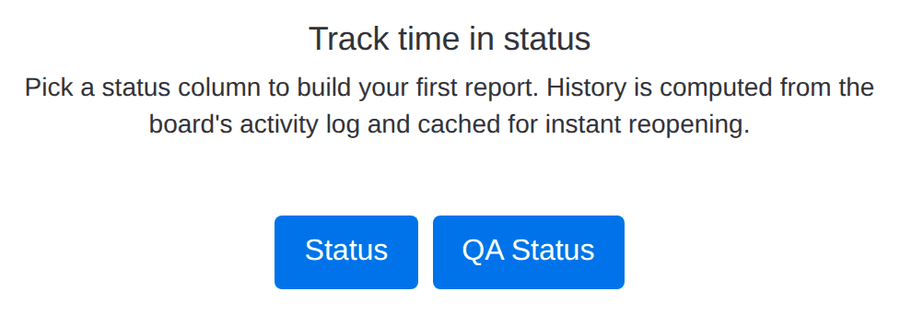
The board is synced before the first screen appears, so what you see is your own board. StatusTrail picks the status column with the most recorded status changes and says why. The card leads with the status where items wait longest and a typical time there, then three figures: the median from start to finish, how many items finished in the last 30 days, and the item that has waited longest. The trail underneath draws each status in your board's colors: the width is the median time, the dots are the items there now, and the callout marks the item waiting longest.
- Keep the suggested column, or use the arrow keys to preview another one. Each preview uses the same math as the report.
- Click the blue Open the report button (it names the column), or press Enter on a column. You can switch columns later from the toolbar.
- A small card then points at three things to try on your report, one at a time: open any duration, show working time, export a CSV. Each one ticks off when you do it, and Next tip moves on. You can replay it from the Welcome guide link in the footer.
1 First run: the busiest status column, picked for you
Needs attention
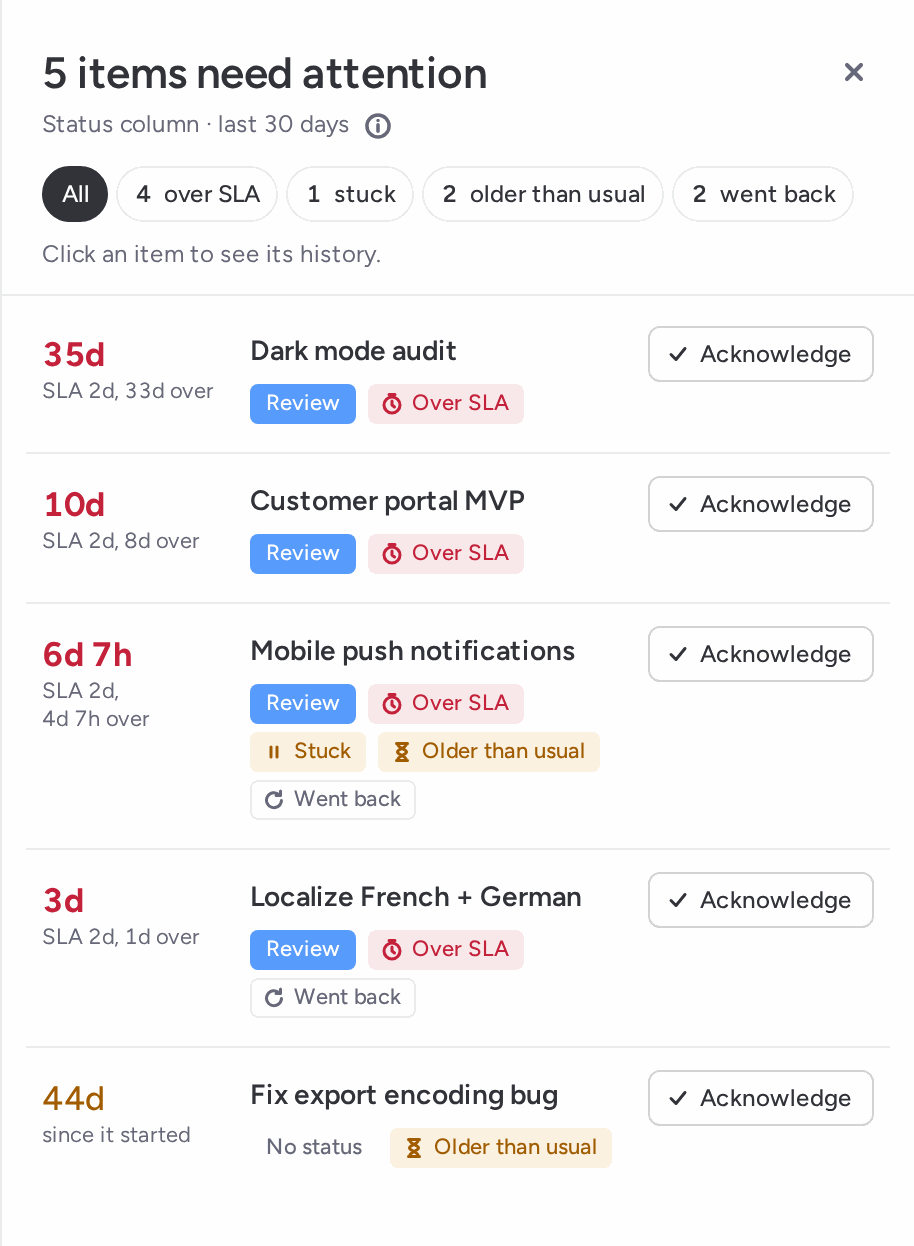
The first cell of the report answers "what needs me now". It counts the items that need you, shows the two most urgent (on wide screens) with their age and how far over the limit they are, and gives one chip per reason. An item is listed once, with every reason that applies:
- Over SLA: its time in the current status is past the limit you set for that status (see SLA thresholds). Counted in business hours when the toggle is on, calendar time otherwise.
- Stuck: an item in progress has been in its current status longer than 85% of past visits to that status took. Needs 5 finished visits to that status.
- Older than usual: an item in progress is older, since its cycle started, than 85% of the items finished in the selected range. Needs 5 finished items in the range.
- Went back: an unfinished item returned to a status it had already left, inside the range.
Only top-level items are counted, and the board's own filters apply. When no status has an SLA yet, the cell offers a link to set one.
2 The first screen: Needs attention, Where work is now, Getting faster?

The Needs attention list
Click Triage, a reason chip or one of the two listed items to open the drawer. Chips at the top filter the list by reason, each with its count. Every row shows the item's age, its status, the reasons that apply and an Acknowledge button. Acknowledging moves the item out of the count for everyone on the board, until its status changes. You get a few seconds to undo, and acknowledged items stay listed in their own group.
Click a row to read the item's history in this status column: a proportional strip of every stay, with the SLA limit marked when one is set, then each visit oldest first with its dates and duration. From there you can acknowledge the item or open it in monday.
The footer of the drawer copies a plain-text summary for a standup or a message: the flow figures, the counts per reason and the open items. The menu next to it downloads the same text as a .txt file or hides item names.
3 The Needs attention list, with one row per item and its reasons
Where work is now
The middle cell is a live bar of every item by current status, in your board's colors, with one chip per status. The line above it names the status that is piling up: the one with the most SLA breaches, or, when nothing is over SLA, the in-progress status holding the most items. Click a chip to filter the table to the items sitting in that status right now; click it again, or Clear, to remove the filter. Hovering a chip highlights its rows. The bar itself keeps showing every item, so you never lose the whole picture.
Getting faster?
The right cell compares the selected range with the period of the same length just before it: the median cycle time and the number of finished items, each with the change. It says Finishing faster or Finishing slower only when both periods finished at least 5 items and the median moved by 10% or more; otherwise it says About the same, or that there are too few finished items to compare. Items that were archived, deleted or moved to another board after finishing are included, and the label says how many. While a status filter is active the cell says the comparison is not shown, because it covers every item.
Flow charts
The Flow card has six tabs, plus People when the board has a People column. Its header shows the range and, for items finished in that range, the count, the median cycle time and the time within which 85% finished (the last two need 5 finished items). Highlights lists up to three things not visible on the current tab, each a button to its tab. The card can be collapsed.
Time per status
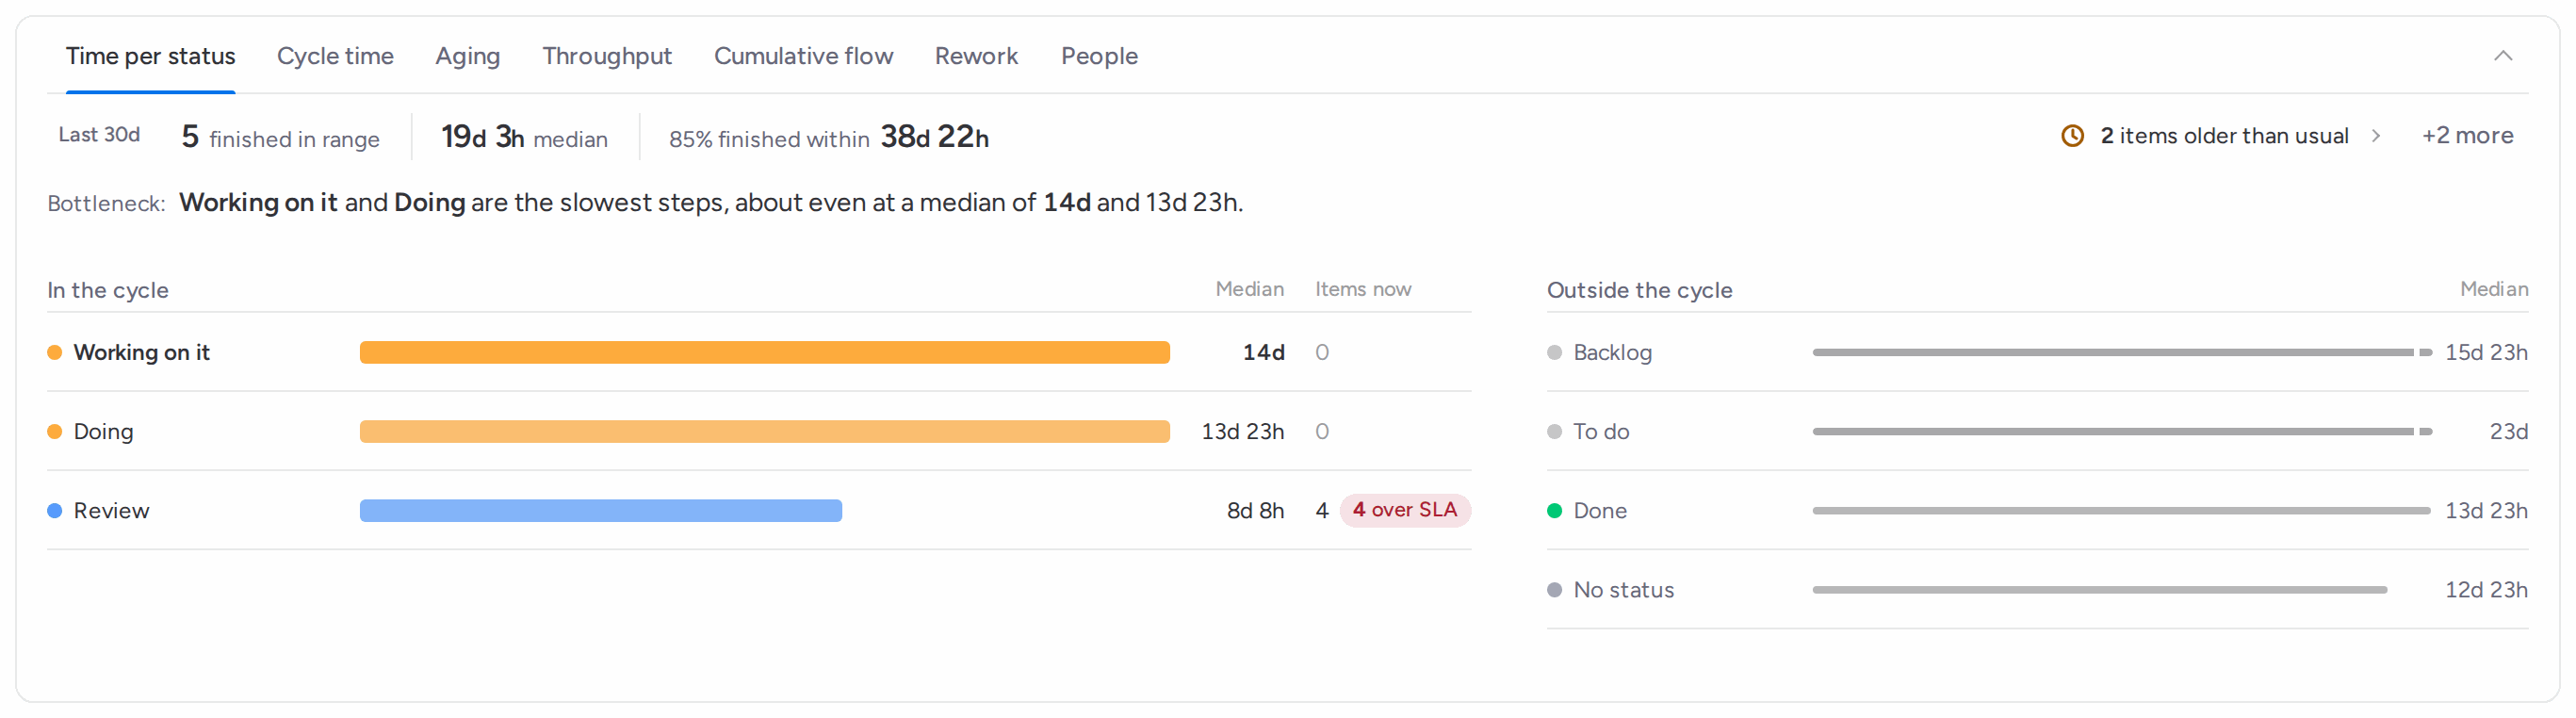
Opens with the bottleneck sentence: the status with the longest median among the in-cycle statuses, and how far ahead it is of the next one (or "about even" when the top two are within 10%). Bars show the median per status, slowest first, scaled to the slowest, with how many items sit there now and how many of those are over SLA. Queues, finished statuses and No status are listed apart under Outside the cycle. Click a bar to sort the table by time in that status.
4 Time per status: the bottleneck, then the median per status
Cycle time
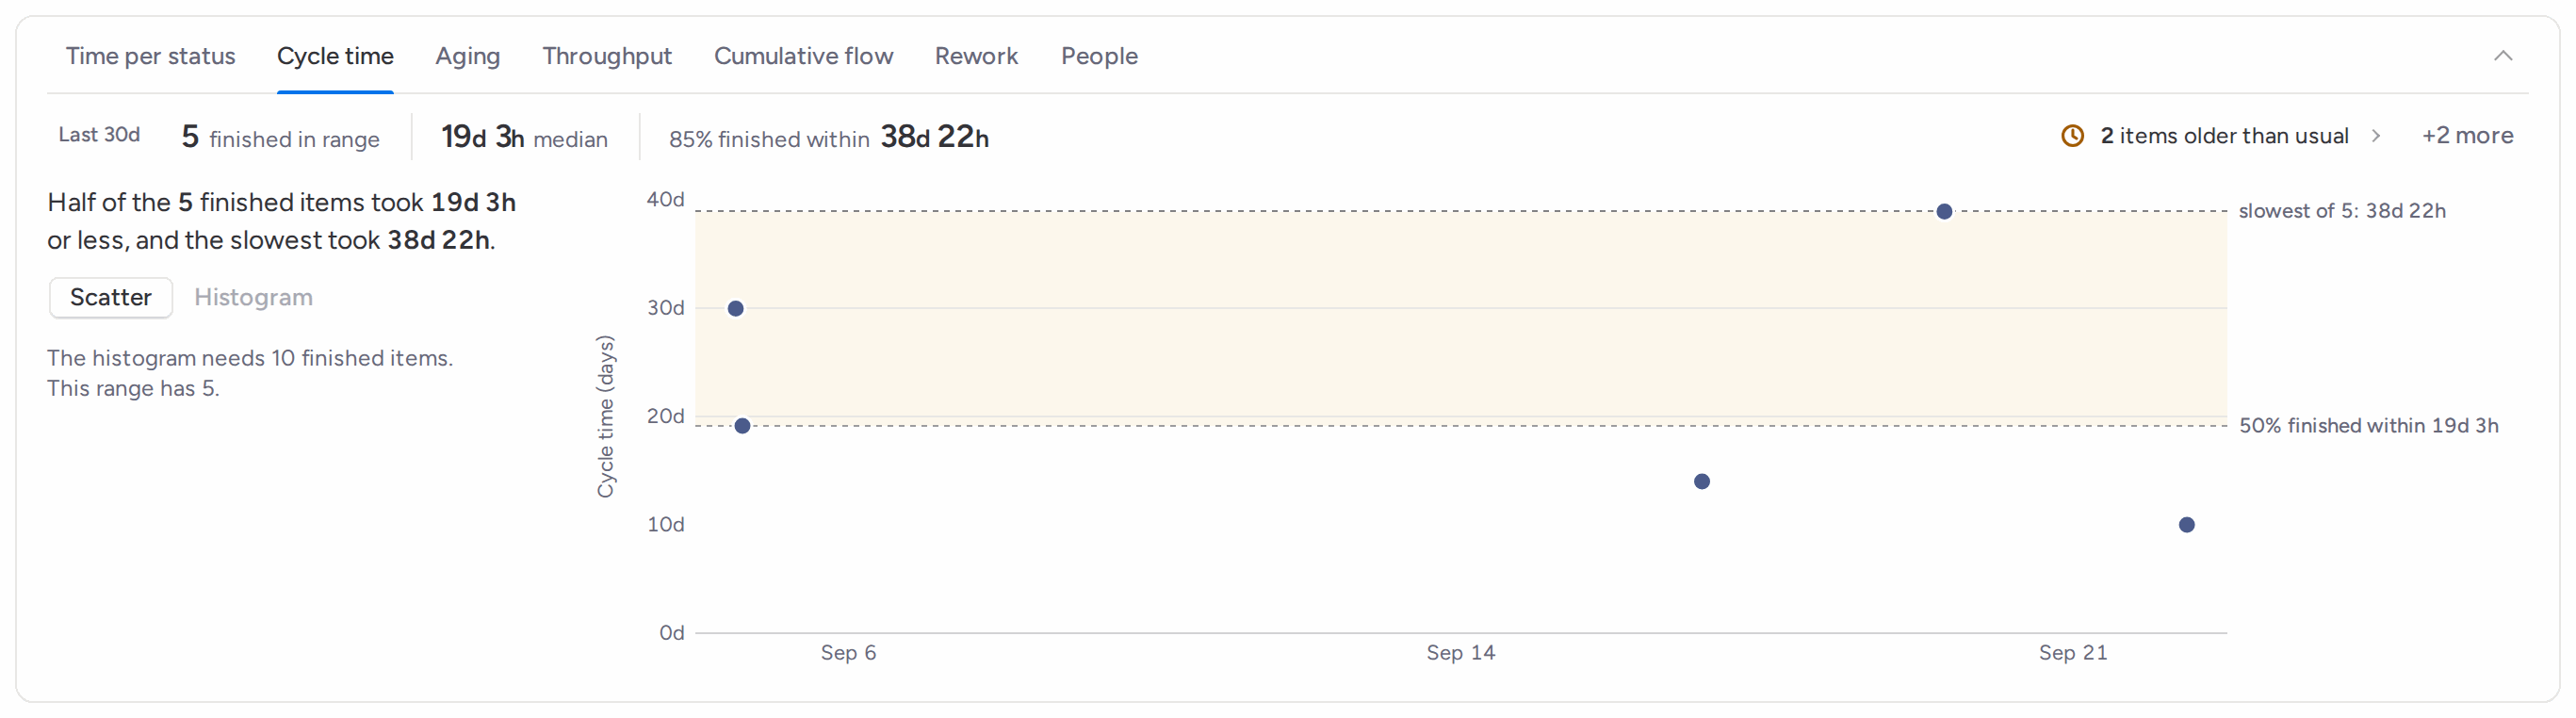
One dot per item finished in the range, placed by finish date and cycle time in days, with dashed lines at the 50, 85 and 95% marks once there are 5 finished items (below 10, the top line simply reads "slowest of N"). The sentence above reads it for you: half of the items took this long or less, and 85% took that long or less. Click a dot to open the item. Switch to Histogram from 10 finished items to see how cycle times spread across bins. Below 5 finished items the tab lists the items slowest first instead.
5 Cycle time as a scatter, with the 50, 85 and 95% lines
Aging
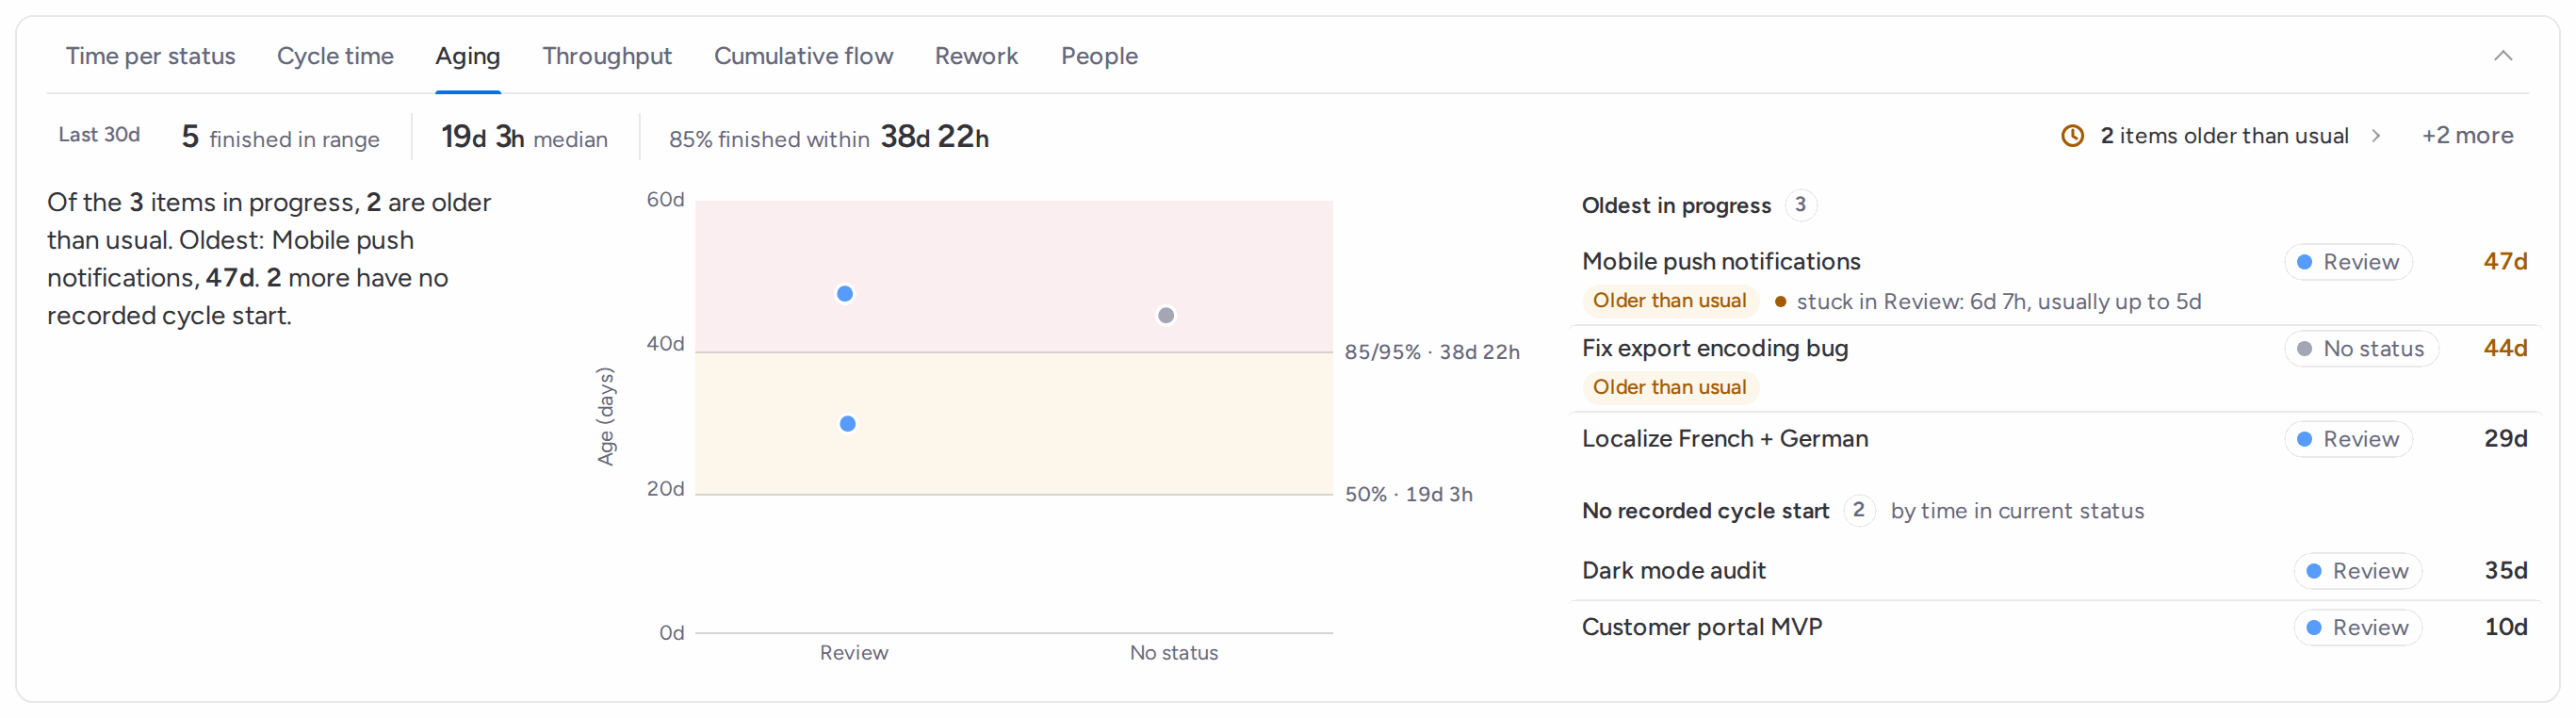
Every item in progress, by current status, with its age since its cycle started. Shaded bands mark the 50, 85 and 95% cycle times of the work finished in the range, so an item drifting past them stands out. The sentence counts how many items are older than usual (older than 85% of the items finished in the range) and names the oldest. The Oldest in progress list adds, per item, whether it is stuck in its current status compared with the usual time there. Hollow dots mean the item started before the synced history, so its age is a lower bound. Items that reached a working status without passing a start status have no cycle age; they are listed apart under No recorded cycle start, by time in their current status. Click any dot or name to open the item.
6 Aging: items in progress against the pace of finished work
Throughput and forecast
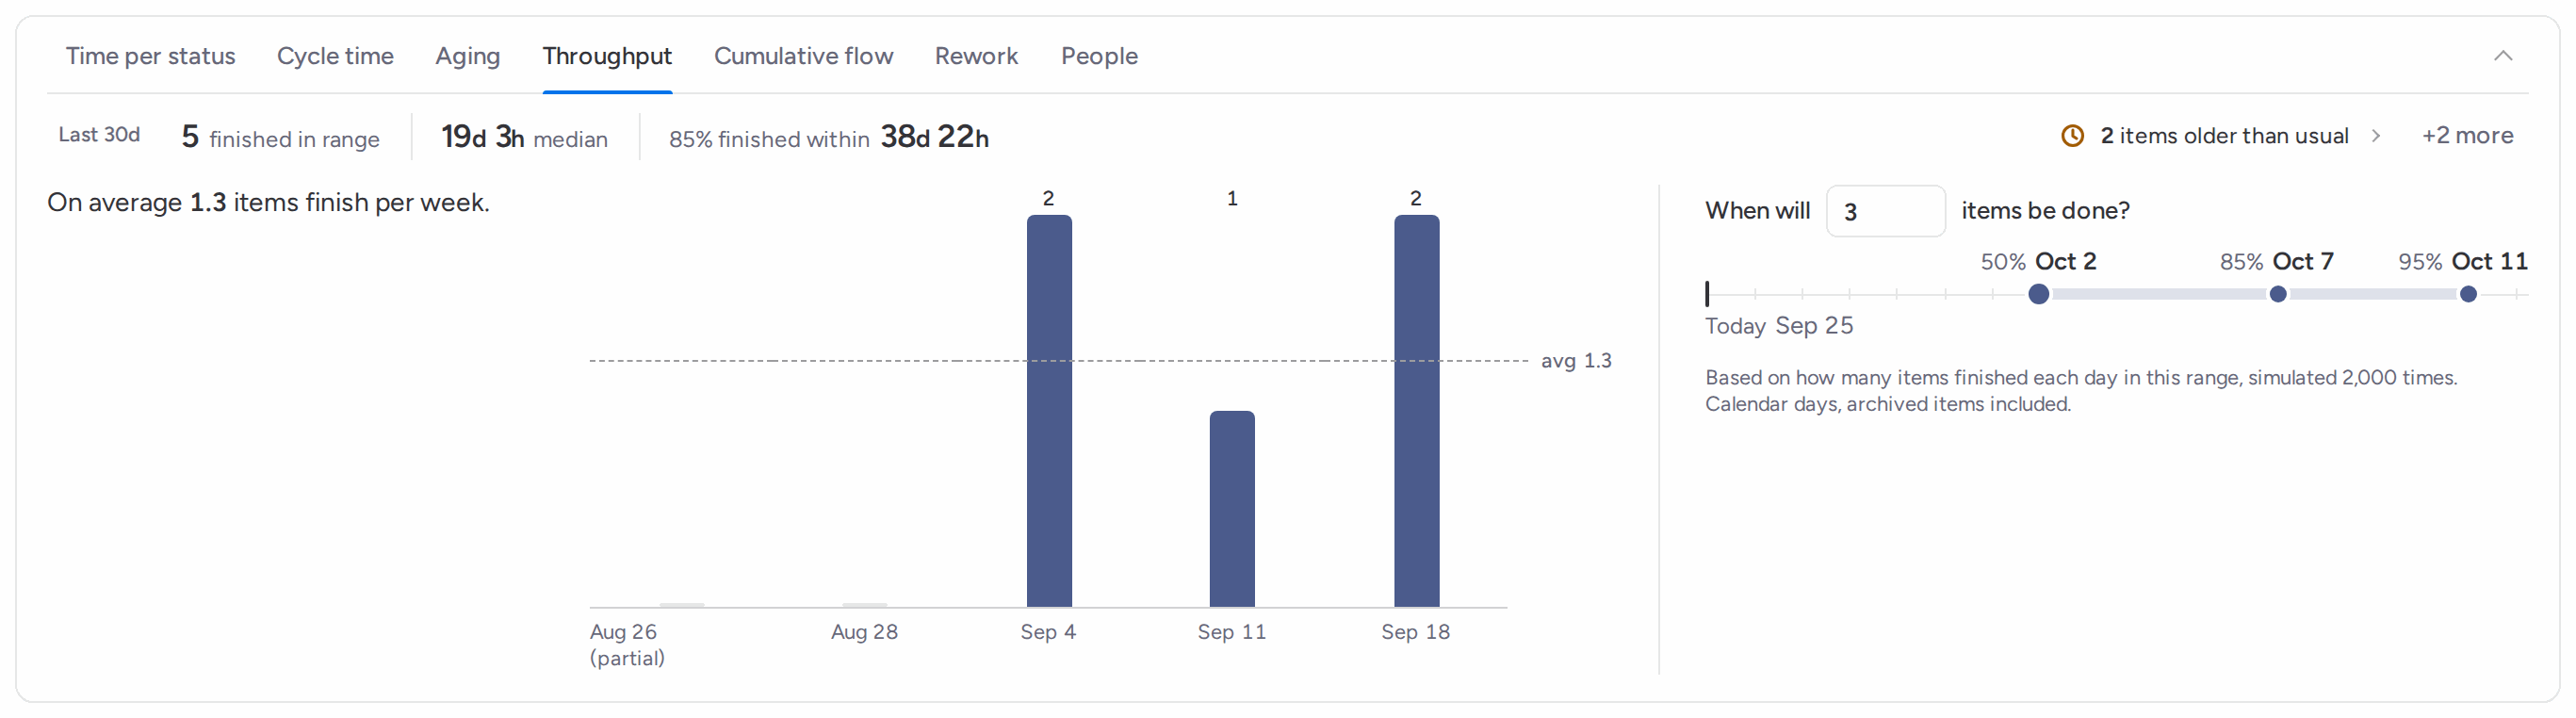
Items finished per day or per week across the range, with the average as a dashed line and the cut-off oldest period marked partial. Next to it, the forecast answers When will N items be done? for any number you type. It replays the daily finishes from this range 2,000 times and reports the dates by which 50, 85 and 95% of those runs are done, on a calendar strip starting today. It needs 5 finished items over at least 7 days, counts archived items once their history is synced, and is not shown while a status filter is active.
7 Throughput per week, and the finish date forecast
Cumulative flow
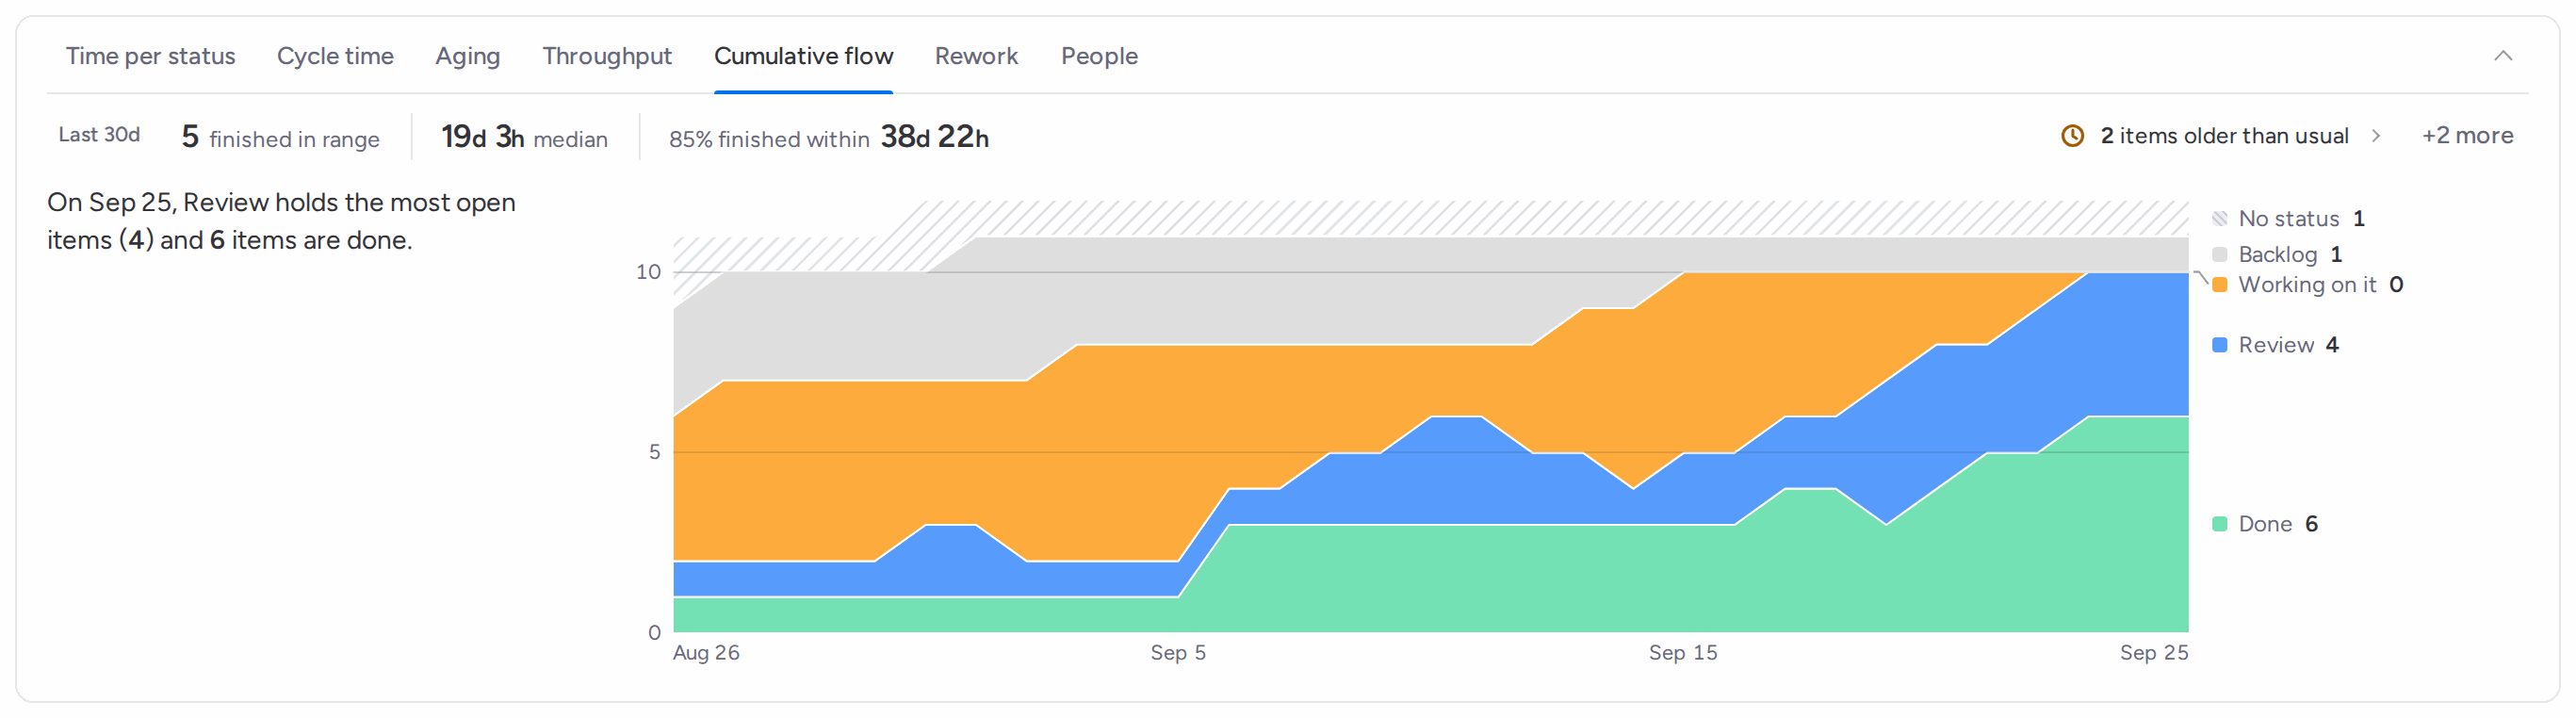
A stacked band per status, one sample per day, showing how many items were in each status across the range. Finished statuses sit at the bottom, No status is hatched on top, and statuses outside the cycle are drawn muted. Each band is labeled with its latest count. Hover or use the arrow keys to read every count on a given day. The sentence names the status holding the most open items on the last day. This chart shows every item, so status filters do not apply to it.
8 Cumulative flow across the range
Rework
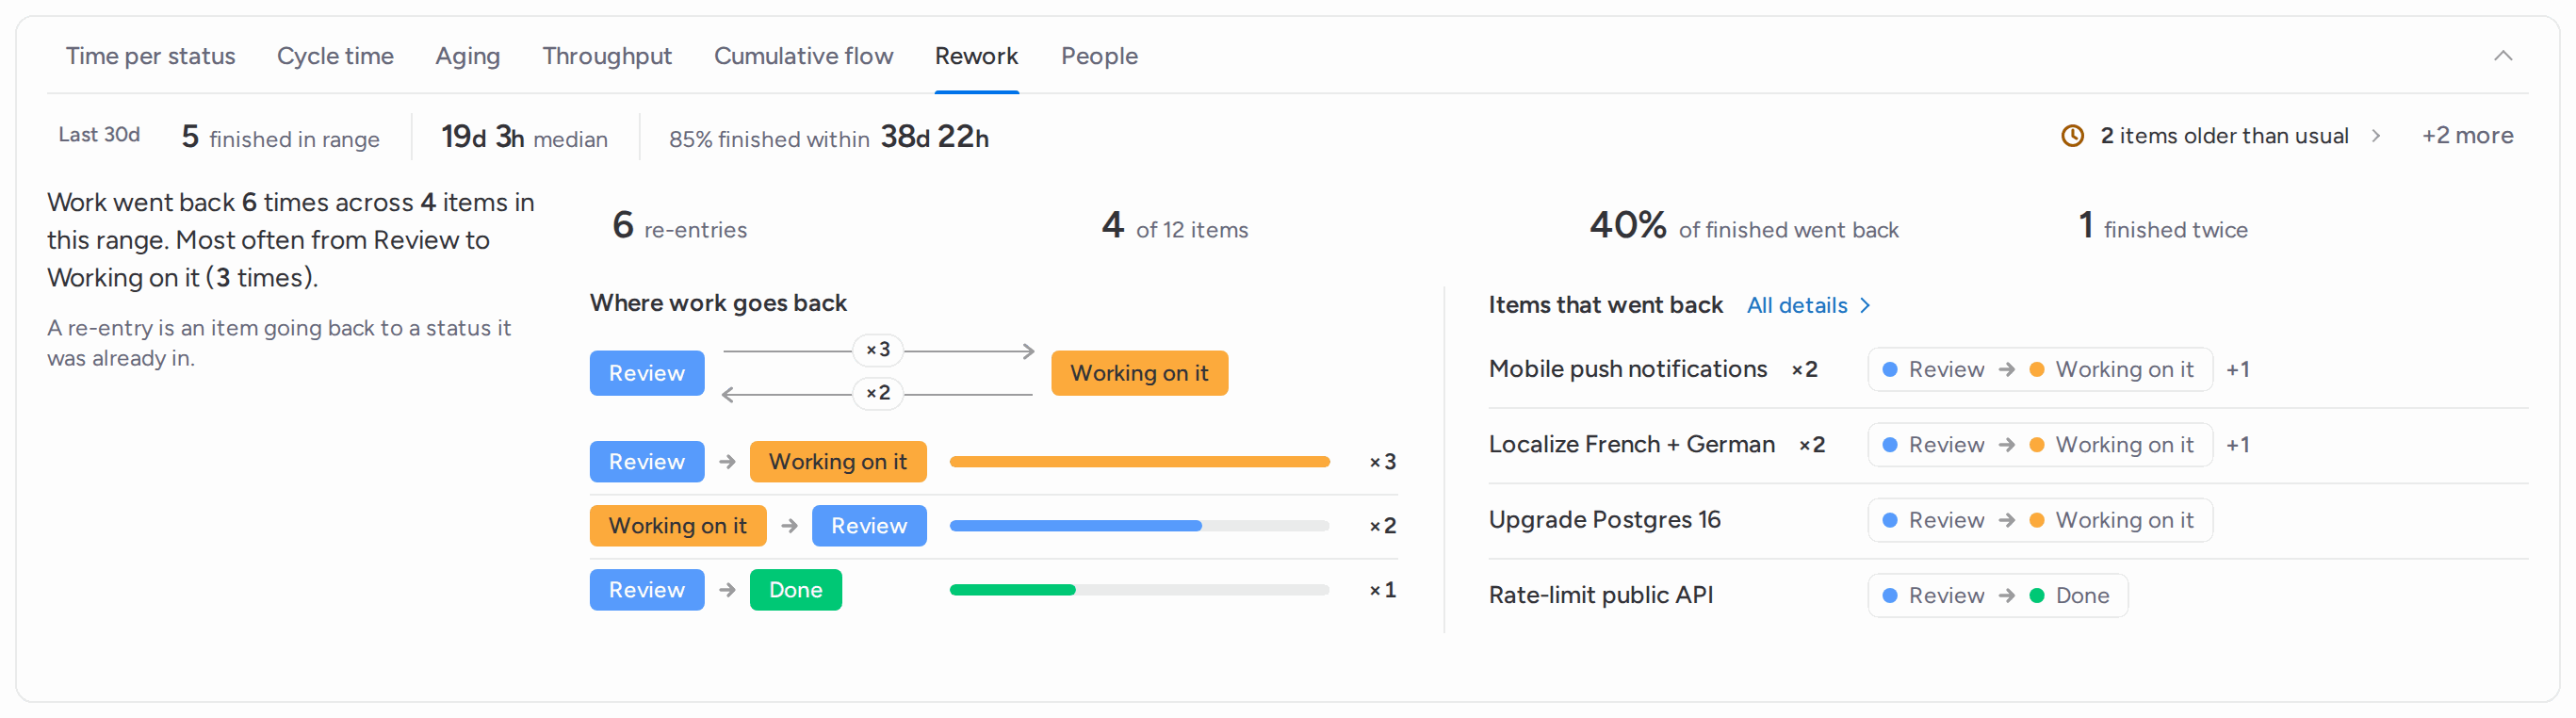
A re-entry is an item going back to a status it was already in, whatever the board order. The tab counts re-entries and affected items in the range, the share of items finished in the range that went back, and the items that left a finish status and came back. The sentence names the most common move back. Where work goes back draws the most common loop between two statuses and ranks every move back with a bar and its count. Beside it, the list shows each item that went back, its count and its moves; click a name to open the item.
9 Rework: which items went back, and where
People
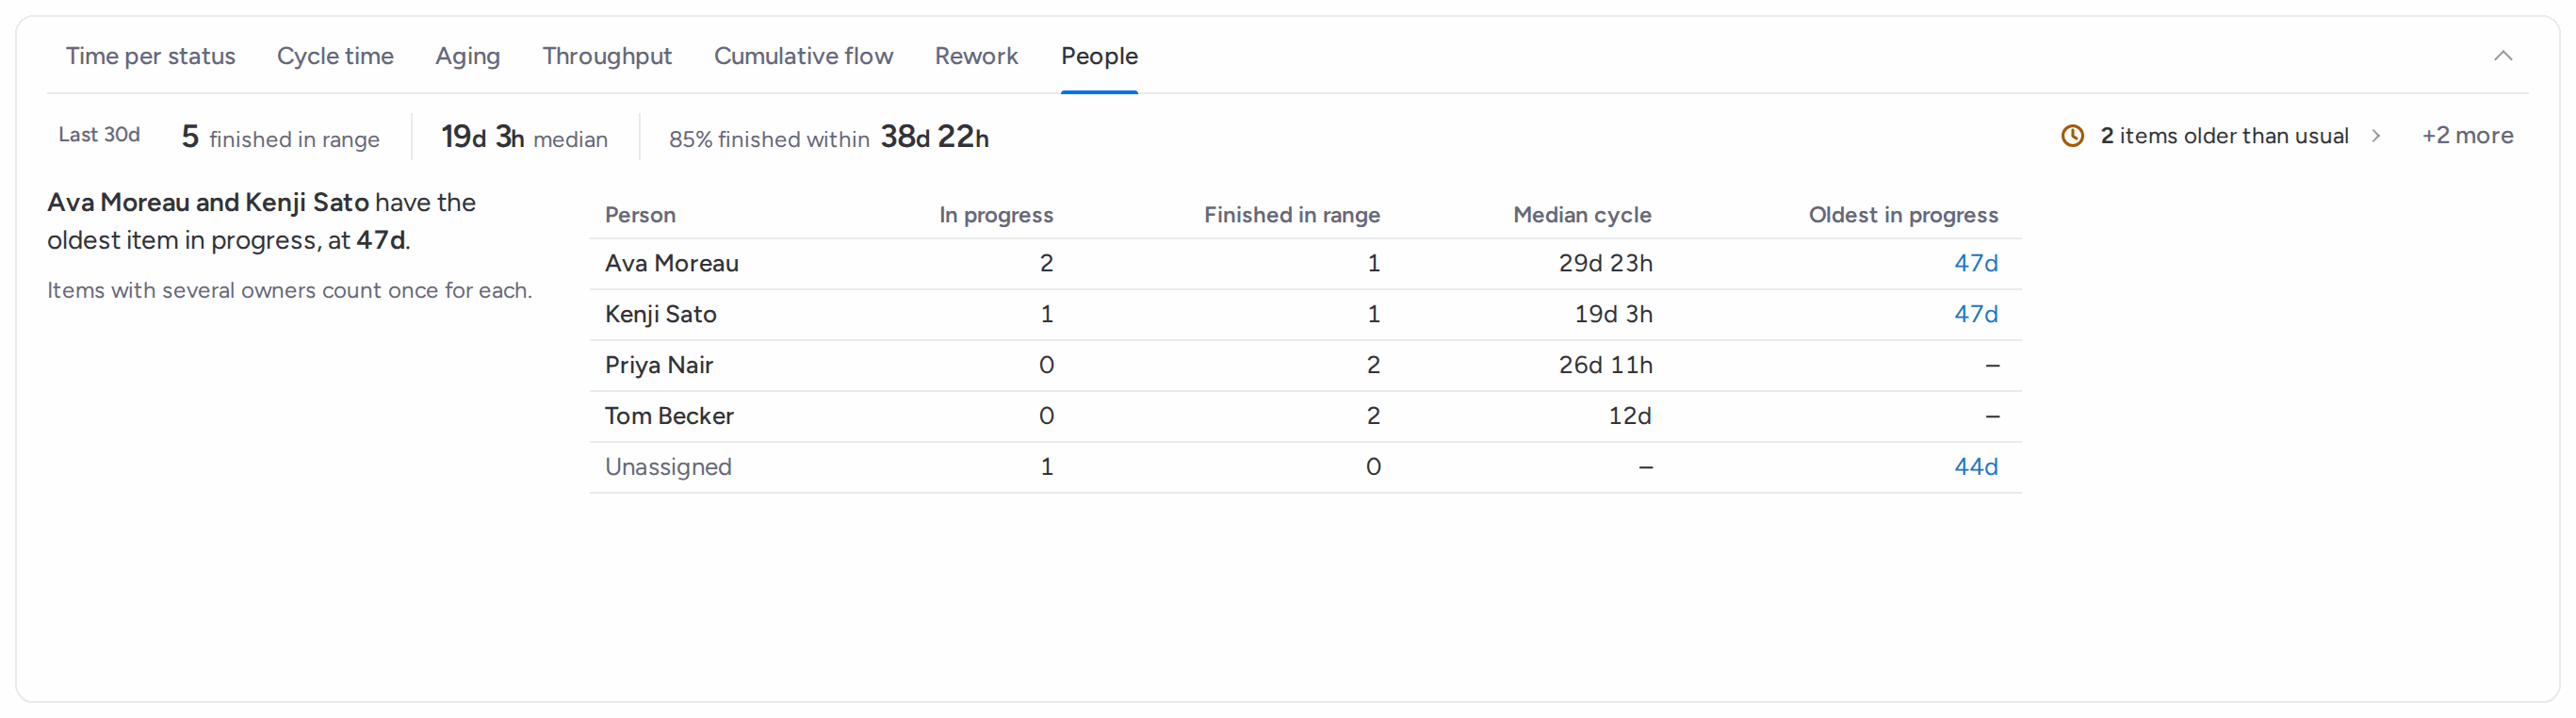
For each person in a People column of the board: items in progress, items finished in the range, their median cycle time and their oldest item in progress (click it to open). Items with several owners count once for each; items with no owner are listed as Unassigned. A dropdown picks the column when the board has more than one.
10 People: in progress, finished, median cycle and oldest item per person
The table
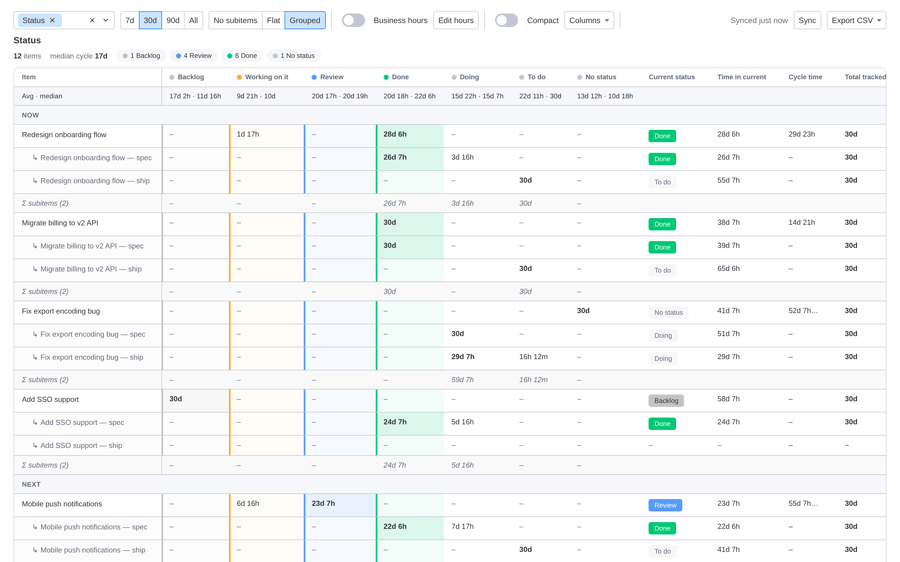
Under the charts, one row per item: its current status, time in the current status, cycle time and total tracked time, then one column per status with the time spent there in the selected range. A Median row gives the median per status column. The time-in-current cell turns red when an item is over SLA, and cells slower than usual for that status are marked. Click an item's name to read its history, with a link to open it in monday.
Subitems
By default each parent lists its subitems beneath it, collapsed, with a Σ row that sums their time per status. In View options you can show subitems flat, as rows of their own, or hide them. Under a status filter only parent items are listed.
11 The table, with subitems grouped under their parents
Sort
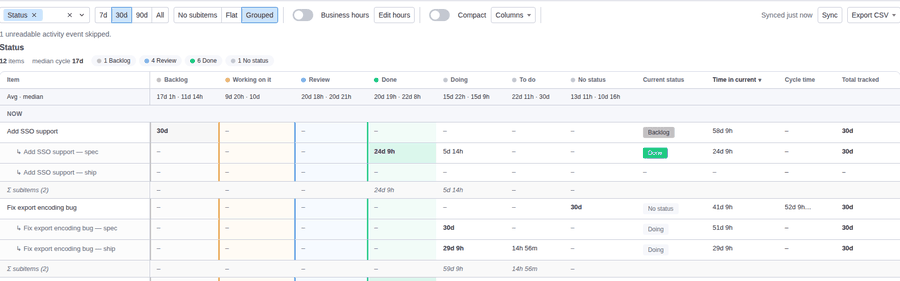
Click any column header to sort descending, click again for ascending, and a third time to go back to board order. The table is a keyboard grid: Tab into it, then move with the arrow keys.
12 Click a header to sort
Click any duration to audit it
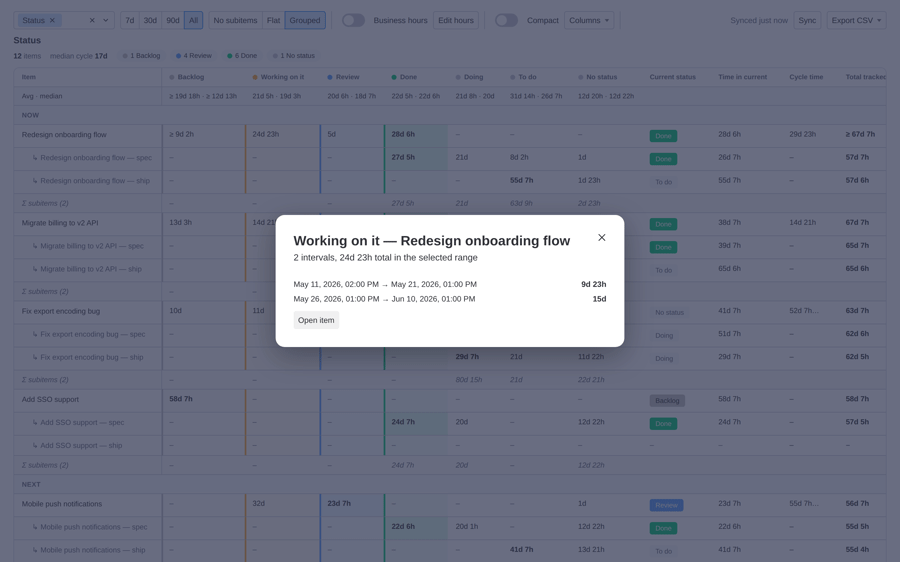
Every duration opens the visits behind it: the status, its total in the selected range, how many times the item entered it, then each visit with its dates and duration. A visit cut by the range shows its real entry date and the total since entry. Below, Status path, all time draws the item's whole history in this column with the time per status. From there, open the item in monday or see its full timeline.
13 The audit behind one duration
Filter by status
Click a status chip in Where work is now to keep only the items currently in that status. A banner names the filter with a Clear control. The Needs attention count, the flow charts that follow the filter and the table all narrow to those items.
14 Filtered to the items currently in Review
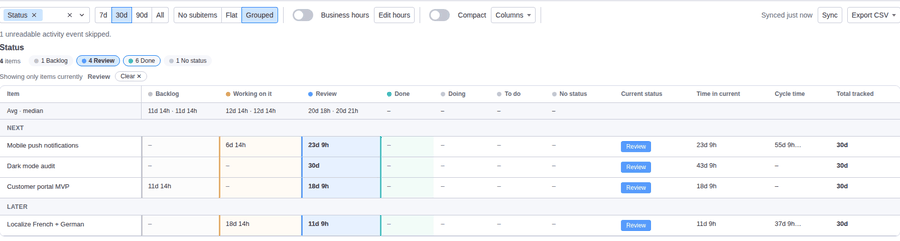
View options
The toolbar has the status column picker, the range (7d, 30d, 90d or All), the Business hours toggle, the sync status, View options and Export CSV. View options holds the settings you set once: subitem mode, compact rows, which columns to show, saved views, your business hours, SLA thresholds and cycle statuses.
15 View options
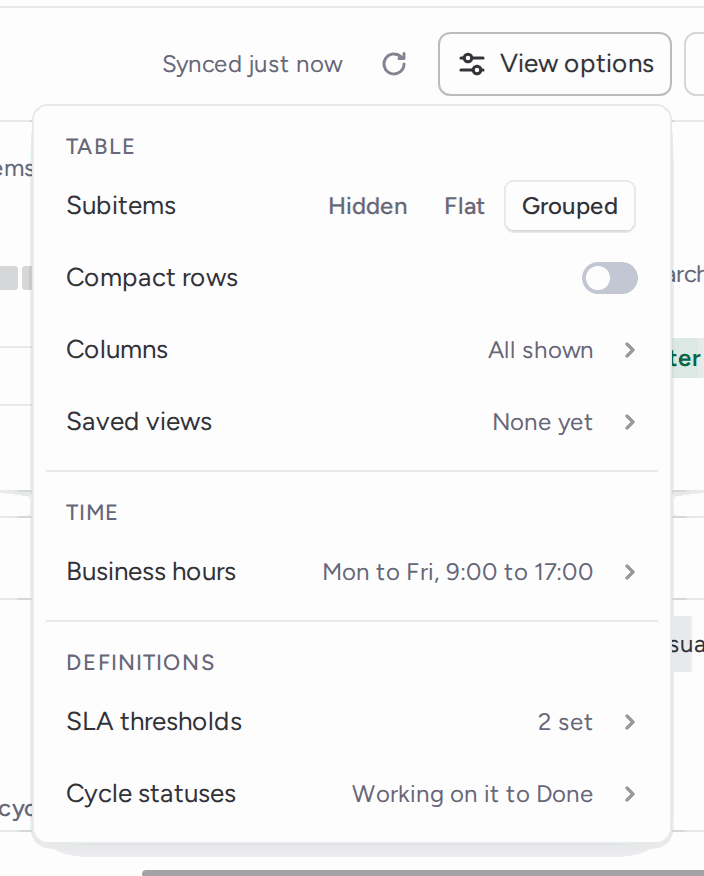
Columns
Show or hide any status column and any of the metric columns: Current status, Time in current, Cycle time, Total tracked.
16 Show or hide any column
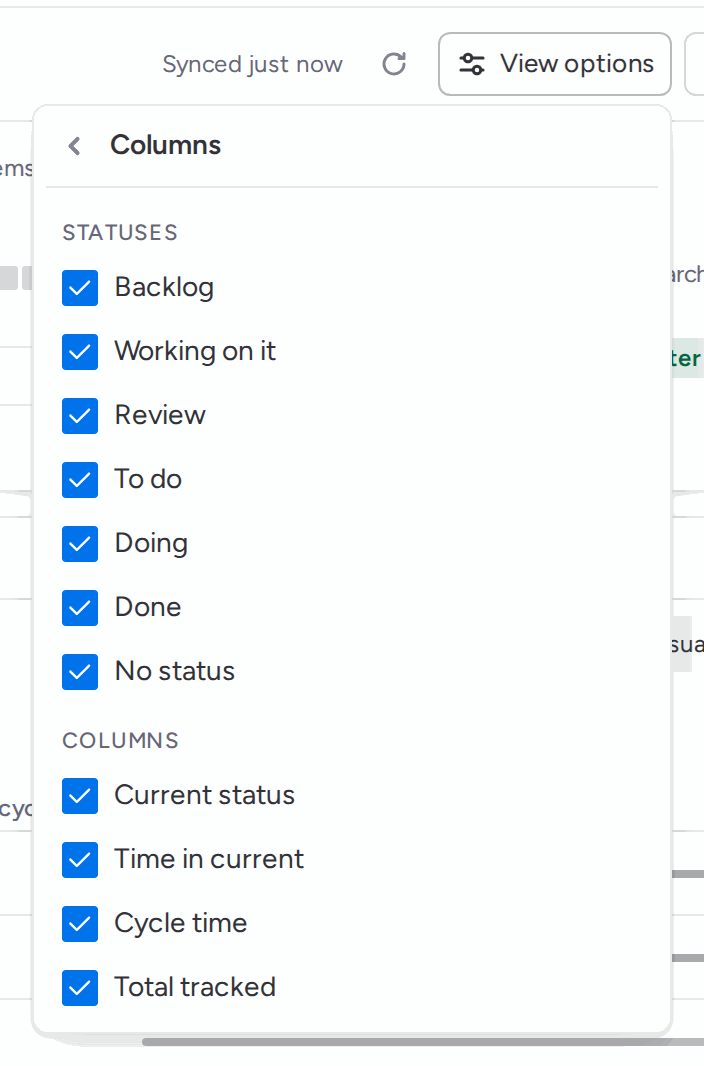
Business hours
Turn on the Business hours toggle in the toolbar to see each status duration in working time too (marked BH, next to calendar time) and to check SLAs in working time. Cycle time and the flow charts stay in calendar time. Set your working days, one start and end time for those days, holidays (one date per line) and your time zone. Nights, weekends, holidays and daylight-saving changes are handled for you. The default is Monday to Friday, 9:00 to 17:00.
17 Set your working week, hours and holidays
SLA thresholds
Set a limit per status, in hours or days. Finish statuses are not tracked. Suggest from history fills the empty rows with the time 85% of past visits to that status stayed under, in business hours when the toggle is on; it needs 5 finished visits per status. An item whose time in its current status is past the limit counts as over SLA: in Needs attention, in red in the table, next to its bar in Time per status, and in two extra CSV columns.
Cycle statuses
Cycle time runs from the first time an item enters a start status to when it reaches a finish status. The defaults are Working on it and Done; on first run StatusTrail infers a matching pair from your labels when those are not on the board (English, French, German and Spanish labels are recognized). You can tick several start and several finish statuses in View options. Queues before the first start status and the finish statuses are outside the cycle.
Export
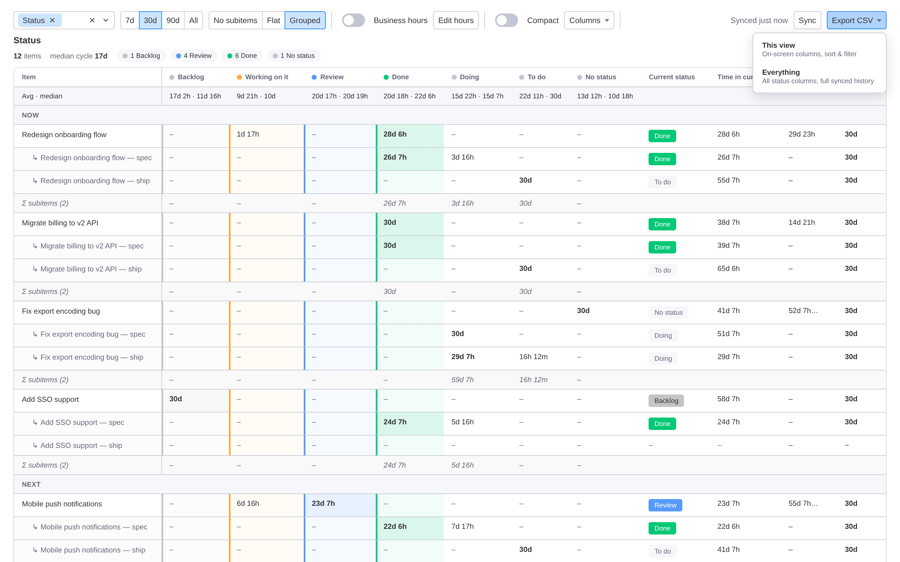
Export CSV downloads two files per status column: the durations table and the per-transition audit trail. Pick the scope:
- This view: exactly the columns, sort and filter on screen.
- Everything: every status column, every item, the full synced history, with subitems as rows of their own.
The durations file has, per status, a raw-seconds column you can sum and pivot and a readable duration; partial values start with ">=". When SLA thresholds are set it adds the threshold and a breached flag per item. The transitions file has one row per status change with its timestamps. Both open cleanly in Excel.
18 Export CSV: This view or Everything
Saved views
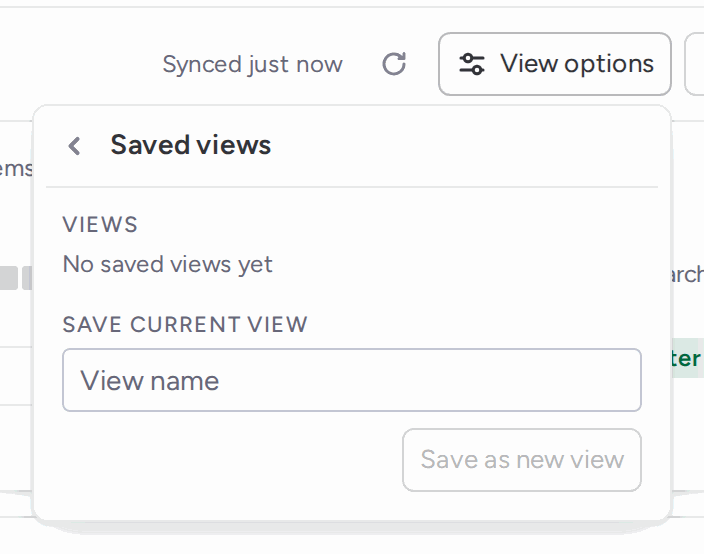
Save the current setup under a name: status columns, range, business hours, subitem mode, cycle statuses, compact rows, hidden columns and SLA thresholds. Saved views belong to the board, so everyone on it sees the same list and can switch, rename or delete them.
19 Save the current setup as a view
Mirror columns
A mirror column can be picked like any status column. Its history is traced from the source board, and the picker says which board that is. This needs access to the source board; if it is unreachable, StatusTrail retries on the next sync. An item linked to several source items has no single timeline and is flagged in the table. Formula and Connect boards columns are not supported yet.
Sync and caching
StatusTrail computes durations once and stores them in monday's own app storage. Reopening the view paints instantly from that cache, then refreshes itself in the background, so anything that changed since the last run appears without a click. The toolbar shows Synced X ago and a sync button to refresh while the view is open.
How far back does it go?
StatusTrail reads the status-change history monday keeps for your plan (from one week on Basic up to five years on Enterprise) and then keeps building its own history in the cache from the day you install. Reports get richer over time, and stay accurate for changes older than monday's own retention window.
A note on accuracy
When StatusTrail can only see part of an item's history (for example, activity older than your monday plan retains), it marks the affected durations with a ≥ sign, in the table, in the median row, in the subitem rollups and in the CSV. It is a lower bound, not an estimate. Events monday returned in an unreadable shape, and items deleted since, are left out of every duration; a note in the footer says so when it happens.
Need help?
Email [email protected]. We read every message.
Missing a feature?
Tell us what you need. We ship fast, and you will hear back within a business day. Request a feature.